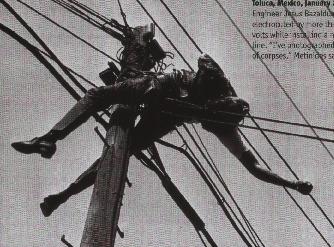
Menstuff® has compiled information and books on the issue of death and dying. See also books Grief. Engineer Jesus Bazaldua Barber (above) is electrocuted by more than 60,000 volts while installing a new phone line. Photo by Enrique Metinides
Slow Dance
Mortality Rates
California lawmakers approve
right-to-die legislation
10 Leading Causes
of Death - 2013
15 Major Causes of Death - 2007
15 Leading Causes of Death -
2005
Top 10 Causes of Death Among Adults Over Age
65
Risk Behaviors of Men
U.S. Death Trends
Shifting
Break
Your Date With Death: 7 Ways to avoid your end
Work-Related Aviation
Fatalities
Talking With Kids About Tough
Issues
Male Paths to Healing: Fixing a
Hole: Grieving With Other Men
Euthanasia - Dying with
Honor and Pride
Oregon's Assisted Suicide
Law
Grieving
Children
Break
Your Date with Death
Death in Cortez,
CO
Death Row
Death of the
Wealthy
Death of middle-aged
whites
In
Memorium
Have you ever watched kids
On a merry-go-round?
Or listened to the rain
Slapping on the ground?
Ever followed a butterfly's erratic flight?
Or gazed at the sun into the fading night?
You better slow down.
Don't dance so fast.
Time is short.
The music won't last.
Do you run through each day
On the fly?
When you ask How are you?
Do you hear the reply?
When the day is done
Do you lie in your bed
With the next hundred chores
Running through your head?
You'd better slow down
Don't dance so fast.
Time is short.
The music won't last.
Ever told your child,
We'll do it tomorrow?
And in your haste,
Not see his sorrow?
Ever lost touch,
Let a good friendship die
Cause you never had time
To call and say,"hi"
You'd better slow down.
Don't dance so fast.
Time is short.
The music won't last.
When you run so fast to get somewhere
You miss half the fun of getting there
When you worry and hurry through your day,
It is like an unopened gift....Thrown away.
Life is not a race.
Do take it slower
Hear the music
Before the song is over
|
Year of Stats |
|
|
|
||||
|
|
|
|
|
|
|
|
|
|
2009 |
|
|
|
|
|
|
|
|
2000 |
|
|
|
|
|
|
|
|
1990 |
|
|
|
|
|
|
|
|
1980 |
|
|
|
|
|
|
|
|
1970 |
|
|
|
|
|
|
|
|
1960 |
|
|
|
|
|
|
|
|
1950 |
|
|
|
|
|
|
|
|
1940 |
|
|
|
|
|||
California lawmakers approve
right-to-die legislation
It was the second effort by California lawmakers this year to allow doctors to prescribe life-ending medication following the highly publicized case of 29-year-old Brittany Maynard, a California woman with brain cancer who moved to Oregon to legally take her life.
Maynard's husband and mother have taken on the cause since her death and were in the Assembly for Wednesday's debate. Lawmakers from both parties invoked their religious faith in arguing for and against the legislation before voting 42-33 in its favor.
"I, as a Christian, do not pretend to know what God has in mind for all of us, why there is pain or suffering in this world. But I do know he is a merciful God. And we have the ability to allow others to have a choice," said Assemblywoman Catharine Baker, R-Pleasanton, who supported the measure. "I believe it is cruel — nothing short of cruel — to deny them that choice in their final hours and final days."
Assembly members were seen as the stumbling block to advancing the bill; the previous version had passed the Senate. Baker, who would have represented Maynard had she stayed in California, was among several GOP lawmakers who supported the bill after previously expressing reservations.
In response to those concerns, several changes were made to boost patient protections, including requirements that the patient be physically capable of taking the medication themselves, that two doctors approve it, that the patient submit several written requests, and that there be two witnesses.
The earlier measure stalled amid religious opposition and hesitant Democrats. The renewed push comes after at least two dozen states have introduced aid-in-dying legislation this year, though none of the bills has passed.
The right-to-die movement has been galvanized by the high-profile case of Maynard, who argued in widely viewed online videos that she should have been able to access life-ending drugs in her home state. Doctors are permitted to prescribe life-ending drugs in Oregon, Washington, Vermont and Montana.
Maynard's mother, Debbie Ziegler, said after the vote that her daughter had left her with a powerful mandate to effect change in California.
"At one time she called me into her room and said, 'This is what I will leave, instead of a child. I'm leaving this, and I want you to speak up for me,' " Ziegler said.
It's not clear where Gov. Jerry Brown, a lifelong Catholic and former Jesuit seminarian, stands on the issue.
Religious groups and advocates for people with disabilities have opposed aid-in-dying legislation, saying it goes against the will of God and puts terminally ill patients at risk for coerced death.
Lawmakers shared deeply personal stories of caring for terminally ill family members and of incredible recoveries. Assemblyman Mike Gipson, D-Carson, questioned the bill's time frame, which requires a doctor to give a diagnosis of six months or less to live.
"I have seen so many miraculous turnarounds in people's lives when the doctors have given up. The doctors have said, 'Do funeral arrangements,' and the prognosis has changed within a matter of hours," said Gipson, who opposed the bill.
The measure was introduced as part of a special legislative session on health care financing convened by the Democratic governor. Brown has declined to take a position on right-to-die legislation, although his spokeswoman said earlier this year that he did not believe the session was the appropriate venue to consider it.
Several Republican lawmakers tried to block Wednesday's Assembly vote on procedural grounds, arguing it was not the right forum for the debate.
If the effort failed in the Legislature, right-to-die advocacy group Compassion and Choices has said it would attempt to qualify for a 2016 ballot measure.
The California Medical Association earlier this year dropped its longstanding opposition to aid-in-dying legislation, taking a neutral stance.
The bill is ABX2-15.
Source: www.aol.com/article/2015/09/09/california-lawmakers-approve-right-to-die-legislation/21233835/?icid=maing-fluid%7Cbon-btest-control%7Cdl2%7Csec1_lnk1%26pLid%3D847287307
![]()
Oregon, Washington, Vemont
"How long do you want to live? How much are you
prepared to invest in your health and mental
well-being? This negotiation calls upon our inner
resources and usually prompts a new willingness to devise stratagems
for eluding death and illness." New Passages. What are you
going to do in the next year to insure that your mind, body and
spirit will be healthy so that you can join us and celebrate the year
2040? That's not that far away. Mortality
Chart
Ratio of Deaths (Men to
Women)
Age in Years Male:Female
1-4 130:100
5-14 158:100
15-24 315:100
25-44 229:100
45-64 162:100
65+ 85:100 (Only because there are few men left to die.)
Accidents 196:100
Suicide 422:100 (Boys/men don't ask for help.)
Homicide 336:100
Source: Statistical Abstract of the US, 1997
10 Leading Causes of Death (Men to Women)
Cause
Heart Disease 237:100
Cancer 112:100
Stroke 119:100
Chronic Obstruction Pulmonary Disease 115:100
Accidents 196:100
Pneumonia 157:100
Diabetes 116:100
HIV 551:100
Suicide 422:100
Homicide 336:100
Source: Statistical Abstract of the US, 1997, for the Year 1994
- Deaths before age 65.
Rank Percent Rank Heart disease: Cancer: Chronic lower respiratory
diseases Accidents (unintentional injuries):
Stroke (cerebrovascular diseases):
Alzheimer's disease Diabetes: Influenza and Pneumonia Nephritis, nephrotic syndrome, and
nephrosis: Intentional self-harm
(suicide): Chronic liver disease Kidney disease Septicemia Source: www.cdc.gov/nchs/fastats/leading-causes-of-death.htm
![]() ;
www.cdc.gov/men/lcod/2013/index.htm
;
www.cdc.gov/men/lcod/2013/index.htm
![]() ;
www.cdc.gov/women/lcod/2013/index.htm
;
www.cdc.gov/women/lcod/2013/index.htm
![]()
nephrosis . Source: * www.cdc.gov/nchs/data/nvsr/nvsr60/nvsr60_06.pdf
![]() page 9, ** 2007 www.cdc.gov/men/lcod/2007/index.htm
page 9, ** 2007 www.cdc.gov/men/lcod/2007/index.htm
![]() ;
*** 2007 www.cdc.gov/women/lcod/
;
*** 2007 www.cdc.gov/women/lcod/
![]()
Short and Full Terms
Some terms in the leading causes of death tables have been shortened from those used in the National Vital Statistics Report. Below is a listing of the shortened terms used in the tables and their full, unabridged equivalents used in the report.
|
Short Terms |
Full Terms |
|
Aortic aneurism |
Aortic aneurism and dissection |
|
Benign neoplasms |
In situ neoplasms and neoplasms of uncertain or unknown behavior |
|
Birth defects |
Congenital malformations, deformations and chromosomal abnormalities |
|
Bronchitis |
Acute bronchitis and bronchiolitis |
|
Cancer |
Malignant neoplasms |
|
C. difficile infection |
Entercolitis due to clostridium |
|
Chronic liver disease |
Chronic liver disease and cirrhosis |
|
Diabetes |
Diabetes mellitus |
|
Gallbladder disorders |
Cholethiasis and other disorders of gallbladder |
|
Heart disease |
Diseases of the heart |
|
HIV disease |
Human immunodeficiency virus (HIV) disease |
|
Homicide |
Assault (homicide) |
|
Hypertension |
Essential (primary) hypertension and hypertensive renal disease |
|
Kidney disease |
Nephritis, nephrotic syndrome and nephrosis |
|
Kidney infection |
Infections of kidney |
|
Legal Intervention* |
Physical or other force used by police or other law-enforcing agents, including military on duty, in the course of arresting or attempting to arrest lawbreakers, suppressing disturbances, maintaining order, and other legal action. Includes legal execution and excludes citizen arrest. |
|
Medical & surgical care complications |
Complications of medical and surgical care |
|
Perinatal conditions |
Certain conditions originating in the perinatal period |
|
Pneumonitis |
Pneumonitis due to solids and liquids |
|
Pregnancy complications |
Pregnancy, childbirth and the peurperium |
|
Stroke |
Cerebrovascular diseases |
|
Suicide |
Intentional self-harm |
|
Unintentional injuries |
Accidents (unintentional injuries) |
|
Source: *World Health Organization.
International statistical Classification of Diseases and
Related Health Problems, Tenth Revision (ICD-10). Geneva:
worked Health Organization, 1992. Available at
http://www.who.int/classifications/icd/en/. Accessed April
15, 2010. www.cdc.gov/men/lcod/2007/index.htm
|
|
(Data are for the U.S. and are final 2009 data; For the most recent preliminary data see Deaths: Preliminary Data for 2010 [PDF - 724 KB])
Number of deaths for leading causes of death
Heart disease: 599,413
Cancer: 567,628
Chronic lower respiratory diseases: 137,353
Stroke (cerebrovascular diseases): 128,842
Accidents (unintentional injuries): 118,021
Alzheimer's disease: 79,003
Diabetes: 68,705
Influenza and Pneumonia: 53,692
Nephritis, nephrotic syndrome, and nephrosis: 48,935
Intentional self-harm (suicide): 36,909
Source: Deaths:
Final Data for 2009, table 10 ![]() [PDF - 1.4 MB] (90 pages)
[PDF - 1.4 MB] (90 pages)
Highlights
Mortality experience in 2009
+ In 2009, a total of 2,437,163 resident deaths were registered in the United States.
+ The age-adjusted death rate, which takes the aging of the population into account, was 741.1
deaths per 100,000 U.S. standard population.
+ Life expectancy at birth was 78.5 years.
+ The 15 leading causes of death in 2009 were:
1. Diseases of heart (heart disease)
2. Malignant neoplasms (cancer)
3. Chronic lower respiratory diseases
4. Cerebrovascular diseases (stroke)
5. Accidents (unintentional injuries)
6. Alzheimer’s disease
7. Diabetes mellitus (diabetes)
8. Influenza and pneumonia
9. Nephritis, nephrotic syndrome and nephrosis (kidney disease)
10. Intentional self-harm (suicide)
11. Septicemia
12. Chronic liver disease and cirrhosis
13. Essential hypertension and hypertensive renal disease (hypertension)
14. Parkinson’s disease
15. Assault (homicide)
+ In 2009, the infant mortality rate was 6.39 infant deaths per
1,000 live births.
Source: www.cdc.gov/nchs/data/dvs/deaths_2009_release.pdf
![]()
15 Leading Causes of Death - 2005
In 2005, a total of 2,448,017 resident deaths were registered in the United States, which is 50,402 more than in 2004. The crude death rate for 2005, 825.9 deaths per 100,000 population, was 1.2 percent more than the 2004 rate (816.5 deaths per 100,000 population)
|
|
|||||||||
|
|
|
|
|||||||
|
|
|
|
Rank |
|
Percent |
Rank |
|
|
|
|
All Causes |
|
|
|
|
|
|
|||
|
Heart |
|
|
|
|
|
|
|
|
|
|
Malignant neoplasms |
|
|
|
|
|
|
|
|
|
|
Cerebrovascular diseases |
|
|
|
|
|
|
|
|
|
|
Chronic lower respiratory diseases |
|
|
|
|
|
|
|
|
|
|
Accidents (unintentional injuries) |
|
|
|
|
|
|
|
|
|
|
Diabetes mellitus |
|
|
|
|
|
|
|
|
|
|
Alzheimer's |
|
|
|
|
|
|
|
|
|
|
Influenza and pneumonia |
|
|
|
|
|
|
|
|
|
|
Nephritis, nephritic syndrome and nephrosis kidney |
|
|
|
|
|
|
|
|
|
|
Septicemia |
|
|
|
|
|
|
|
|
|
|
Intentional self-harm (suicide) |
|
|
|
|
|
|
|
|
|
|
Chronic liver disease and cirrhosis |
|
|
|
|
|
|
|
|
|
|
Essential (primary) hypertension and hypertensive renal disease (hypertension) |
|
|
|||||||
|
Parkinson’s |
|
|
|
||||||
|
Assault (homicide) |
|
|
|
||||||
|
Other |
|
|
|||||||
|
|
|||||||
|
|
|
||||||
|
|
|
|
|
|
|
|
|
|
All Causes |
|
|
|
|
|
||
|
Heart |
|
|
|
|
|
|
|
|
Malignant neoplasms |
|
|
|
|
|
|
|
|
Cerebrovascular diseases |
|
|
|
|
|
|
|
|
Accidents (unintentional injuries) |
|
|
|
|
|
|
|
|
Chronic lower respiratory diseases |
|
|
|
|
|
|
|
|
Diabetes mellitus |
|
|
|
|
|
|
|
|
Influenza and pneumonia |
|
|
|
|
|
|
|
|
Alzheimer's |
|
|
|
|
|
|
|
|
Nephritis, nephritic syndrome and nephrosis |
|
|
|
|
|
|
|
|
Septicemia |
|
|
|
|
|
|
|
|
Intentional self-harm (suicide) |
|
|
|
|
|
|
|
|
Chronic liver disease and cirrhosis |
|
|
|
|
|
|
|
Top 10 Causes of Death Among Adults Over Age
65
1) Heart Disease
Heart disease is the number one cause of death among adults over the age of 60. Heart disease includes conditions such as heart failure, heart attack and heart arrhythmia that can cause the heart to beat ineffectively and impair circulation. Heart disease is associated with or caused by, diabetes, high blood pressure, smoking, improper diet and lack of exercise. It can also have a genic component.
2) Cancer
Cancer is the second leading cause of death among seniors. It includes all cancers including, breast cancer, colon cancer, and skin cancer. Also included are the malignant blood and bone marrow diseases that cause leukemia. Many cancers occur at a higher rate among older adults, thought the cause for that is not clear. Cancers can also be more difficult to treat due to other health conditions that may also be present.
3) Cerebrovascular Disease
More commonly know as stroke, cerebrovascular disease can be caused by either a clot or blockage that cuts off blood flow to a part of the brain or by hemorrhage. In both cases there is damage or death of brain tissue that can cause paralysis, speech disorders, swallowing problems and immobility. People with diabetes and high blood pressure are at higher risk of stroke.
4) COPD
Chronic obstructive lung disease decreases the lungs ability to exchange carbon dioxide for oxygen. As the disease progresses the patient has to work harder and harder to breath, often feeling as if they are suffocating. These diseases are often linked to a lifetime of smoking, but can be due to environmental factors.
5) Pneumonia
Pneumonia is the fifth highest killer of older adults, especially during the winter months of flu season. At high risk are seniors with chronic diseases such as diabetes heart disease and respiratory conditions. The flu and pneumonia shots are recommended for all adults over the age of 55 to help prevent this killer.
6) Diabetes
Type two diabetes, also known as adult onset diabetes is a chronic disease that lowers the immune system and can increase risk of stroke, heart disease and other circulatory problems. Wounds take longer to heal and respiratory infections like pneumonia often are more severe.
7) Accidents
Seniors are more at risk of accident due to balance disorders, failing eyesight and slower reflexes. Simple falls can result in fractures that cause immobility, disability and may hasten death. Accidents cannot be planned, but precautions can be made to prevent them.
8) Septicemia
Septicemia refers to the presence of pathogenic bacteria in the blood. This can cause overwhelming infection and death. Anthrax is just one of many organisms that can cause such a massive infection.
9) Nephritis
Nephritis is an inflammation of the kidney, and can be chronic or acute. It can result from bacterial infection, or toxic drugs such as mercury: arsenic or alcohol. It can progress to renal failure with decreased urine output and a built up of toxins in the blood. Chronic renal failure may lead to a need for dialysis.
10) Alzheimers
This progressive and always deadly disease is characterized by progressive memory loss, personality changes and eventually a complete loss of function and ability. The causative factor is unknown, and there is no cure, though there are some medications that can slow its progression slightly.
Source: seniorhealth.about.com/cs/conditions/tp/cause_death.htm
![]()
Work-Related Aviation Fatalities
For all aircraft crashes during the study period, National Transportation Safety Board (NTSB) Accident Briefs were abstracted to obtain information about flight purpose, weather, aircraft, pilot, and probable cause. These reports were merged with records from the Alaska Occupational Injury Surveillance System, a database established and maintained by CDC's National Institute for Occupational Safety and Health, which includes information about cause of death, occupation of decedent, and circumstancesassociated with the crash. This study includes all occupational deaths related to commercial, military, and general aviation (i.e., all flying not involving military aircraft, scheduled airlines, and commuter or air-taxi service). For this analysis, an aircraft crash was defined as an incident in Alaska in which an aircraft in motion sustained substantial damage or an incident that resulted in injury or death to an aircraft occupant. An aircraft crash was categorized as occupational if at least one of the occupants in the aircraft was 1) working for pay or compensation; 2) working as a volunteer emergency medical technician, firefighter, or law enforcement officer; 3) traveling on business, including to and from customer/business contacts; or 4) engaging in a work activity in which the aircraft is the work environment. Denominator data for rates were based on 1990 U.S. Bureau of the Census and Alaska Department of Labor estimates. \
During 1990-1994, a total of 876 aircraft crashes occurred in Alaska; of these, 405 (46%) were occupational. Overall, 106 (12%) crashes resulted in at least one fatality, and 69 (65%) of these were classified as occupational. Of these, 62 (90%) involved fixed-wing aircraft, and seven (10%) involved helicopters. Nearly all (61 [98%]) of the fixed-wing crashes involved propeller-driven aircraft; 54 (89%) were single-engine aircraft. No occupational fatalities occurred on scheduled commercial airline operations.
A total of 192 occupants were on board the 69 aircraft involved in the fatal occupational crashes; 149 (78%) of these occupants were killed. Of the 149 fatalities, 99 (66%) were occupation-related. The annual occupational fatality rate for pilots in Alaska was 268 per 100,000, 2.1 times higher than the U.S. pilot-specific rate of 126 per 100,000 (1). For all workers in Alaska, regardless of occupation, the death rate for work-related aircraft crashes was 8.3 per 100,000, 27.1 times higher than the U.S. rate of 0.3 per 100,000 (1).
The mean number of persons on board the aircraft was 2.8 (range: one-11); in 23 (33%) of these crashes, only the pilot was on board at the time of the crash. The mean age of the occupational decedents was 39 years (range: 20-68 years), and most (58 [59%]) were aged 30-44 years. In addition, nearly all (96 [97%]) deaths occurred among men. The most common cause of death was multiple impact injuries (48 [48%]), followed by head injuries (27 [27%]) and injuries to the chest (11 [11%]).
The takeoff and landing phases of flight together accounted for 228 (56%) occupational crashes, but for only eight (12%) of the fatal occupational crashes. Most (137 [60%]) of these crashes were associated with unimproved, off-airport sites (e.g., sandbars, mountain ridges, and meadows). Controlled flight into terrain during the cruise phase of flight (i.e., straight and level flying) or the maneuvering phase of flight (i.e., changing altitude or direction) together accounted for 46 (67%) fatal occupational crashes. The most common (28 [41%]) impact sites of fatal crashes were mountain sides and passes.
The Federal Aviation Administration (FAA) defines two categories of flying conditions based on meteorologic considerations. Instrument Meteorological Conditions (IMC) exist when visibility is less than 1 mile or the aircraft cannot be operated clear of clouds or overcast; in IMC, pilots must rely on instrumentation for navigation. Visual Meteorological Conditions (VMC) exist when visibility is greater than or equal to 1 mile and pilots can use visual cues for navigation. In Alaska, crashes occurring under IMC were 5.3 times (95% confidence interval=3.5-7.9) more likely to be associated with a death than crashes in VMC.
NTSB determined that pilot error (defined as aircrew action or inaction that became a contributing cause or factor in the crash) was a cause in 53 (77%) of the fatal occupational aviation crashes in Alaska. In addition, 23 (33%) of the aircraft involved in fatal occupational incidents were not completely destroyed; however, only 22% of the occupants of these aircraft survived. Reported by: Alaska Field Station, Div of Safety Research, National Institute for Occupational Safety and Health, CDC.
Editorial Note: When compared with risks for all U.S. workers, occupational aviation fatalities among workers in Alaska accounted for a disproportionate number of occupational fatalities in that state: workers in Alaska were 27 times more likely to be killed in an aircraft than were all U.S. workers. This increased risk reflects, in part, the greater use of aircraft for routine transportation in Alaska. Controlled flight into terrain during the transition from VMC to IMC was the most frequently identified cause of occupational crashes. This transition is a difficult flight task for pilots, and FAA regulations prohibit pilots of single-engine aircraft from flying in IMC while carrying passengers for compensation.
In Alaska, many pilots risk flying into potentially hazardous conditions because of the demand for reliable air service. In 1994, 70% of pilots in Alaska involved in the commuter and air-taxi industry reported inherent pressures in their flight operations, including self-induced pressures, mail-delivery responsibilities, and pressures from passengers, management, and other pilots (2). Approximately half of pilots surveyed reported having flown from VMC into IMC on at least one occasion, and 84% reported having inadvertently entered IMC on a VMC flight. Weather conditions in Alaska can change rapidly, and the vast distances between some weather reporting points often conceal substantial local variation in the weather. However, VMC flight into IMC usually involved poor pilot decision making (3).
The frequency of pilot error in the incidents described in this report underscores the need for the development and introduction of Alaska-specific Aeronautical Decision Making (ADM) and judgement training (3). ADM is designed to assist pilots in making better decisions during potentially hazardous conditions, to avoid situations that require skill beyond their capabilities, and to reduce the number of judgement-related crashes. The FAA has proposed requiring ADM training for all levels of pilot certification in the United States (4).
NTSB has recommended that all pilots use protective equipment to reduce aviation fatalities (5). Helmets, energy-absorbing structures, padding the occupant's immediate environment, and use of shoulder restraints could reduce the number of aircraft-related occupational fatalities (5,6).
This analysis produced a descriptive characterization of the epidemiology of occupational aviation fatalities in Alaska. Additional efforts will be required to assess the association between other potential risk factors (e.g., carbon monoxide exposure, aging aircraft, pilot fatigue, and risk-taking) and occupational aviation fatalities. One important limitation of this analysis was the lack of accurate and reliable denominator data to control for exposure (i.e., flight hours). Fatal aircraft incident rates provided by the NTSB generally are presented as fatal incidents per 100,000 aircraft flight hours; however, these rates are based on national estimates, and these estimates cannot be applied to occupational aviation in Alaska.
In response to this study, the Alaska Interagency Working Group for the Prevention of Occupational Injuries has formed an aviation working group (including representatives from industry and state and federal agencies), to determine strategies for reducing such crashes. Ongoing activities include data collection and dissemination of information to local news media, industry, and educational and flight-safety organizations in Alaska.
References
1. Toscano G, Windau J. Compensation and working conditions.
Washington, DC: Bureau of Labor Statistics, National Census of Fatal
Occupational Injuries, 1995.
2. National Transportation Safety Board. Aviation safety in Alaska:
safety study. Washington, DC: National Transportation Safety Board,
1995; document no. NTSB/SS-95/03.
3. National Transportation Safety Board. Safety recommendation.
Washington, DC: National Transportation Safety Board, 1995; document
no. A-95-121-136.
4. Federal Aviation Administration. Notice of proposed rule-making:
95-11, human factors and aeronautical decision making. Part 61 B,
Human Factors (paragraph 28) and ADM (paragraph 29). Federal Register
1995;60:41160.
5. National Transportation Safety Board. General aviation
crashworthiness project: impact severity and potential injury
prevention in general aviation accidents. Springfield, Virginia:
National Technical Information Service, 1985; document no.
NTSB/SR-85/01.
6. Desjardins SF, Laananen DH, Singley GT. Aircraft crash survival
design guide: design criteria and checklist. Vols 1-4. Springfield,
Virginia: National Technical Information Service, 1980; document no.
AD-A093784.
Deaths/Mortality
(All figures are for U.S.)
Number of Deaths Annually: 2,314,245 (1997)
Death Rate (age-adjusted): 479.1 deaths per 100,000 population
(1997)
Ten Leading Causes of Death in the U.S.:
Source: National Vital Statistics Report, Vol. 47, No.19
Heart Disease: 726,974
Cancer: 539,577
Stroke: 159,791
Chronic Obstructive Pulmonary Disease: 109,029
Accidents: 95,644
Pneumonia/Influenza: 86,449
Diabetes: 62,636
HIV/AIDS: 16,516
Suicide: 30,535
Chronic Liver Disease and Cirrhosis: 25,175
Source: NAT
Prostate Disease
(All figures are for U.S.)
Annual Number of Deaths from Prostate Cancer: 34,123 (1996)
Source: National Vital Statistics Reports, Vol. 47, No. 9
Cases of Prostate Disease Reported Annually: 2.6 million (1995)
Source: Vital and Health Statistics Series 10, No. 199
Number of Ambulatory Care Visits for Prostate Cancer: 2.4 million (1996)
Source: Vital and Health Statistics Series 13, No. 134
Cancer
(All figures are for U.S.)
Deaths Annually: 539,577 (1997)
Age-Adjusted Death Rate: 125.6 deaths per 100,000 population
(1997
Cause of Death Rank: 2 (1997)
Source: National Vital Statistics Report, Vol. 47, No. 19
Hospital Discharges: 1,374,000 (1996)
Average Length of Hospital Stay: 7.0 days (1996)
Source: Advance Data 301
Male Paths to
Healing: Fixing a Hole: Grieving With Other Men
This hole was to be the home of a tree that was being given as a memorial to my father who had died the previous November. I had known the hole needed digging, but had put off the task until now - now being just about the last possible moment it could be dug. As I continued digging, I found myself flooded with memories of my father. My thoughts moved back and forth between recent events leading up to his death and childhood experiences. I remembered his engineering talents and nature and tried to dig the hole in a way that would please him.
As I dug, the feelings flowed through me: the sadness of missing him, the gratefulness of having been his son, and the anger and frustration of my powerlessness. All of these feelings found their way into this hole. The act of digging became an avenue for the various thoughts and feelings to arise. Through the action I was opened to my own inner world.
I started wondering why I had put off this job, then realized that I hadn't, and didn't, want to do it. Actually digging the hole brought the death more into reality, and a part of me didn't want that. I've learned to accept this part of me that wants to deny things. Denial is not really such a bad thing, and it doesn't go away as quickly as some people seem to think. I've noticed it has a slow, zigzag decay that can last a long time. In a way, denial can be our friend, allowing us to slowly accept the reality at hand. I became aware of the battle going on between the denying part and the digging-the-hole part. As a friend of mine says, "We have wetware, not hardware."
The tree was planted in an emotional ritual attended by myself and the six men who donated the tree. The activity became an avenue for all of us to delve into our interiors and connect with a variety of issues, from relationships with our fathers to the finality of death. The activity of buying, digging, planting, and gathering together became a hub for a wide variety of spin-offs. As we stood around the tree, we all had a chance to speak and to listen, and somehow having an activity made this process flow smoothly. It would have been much more difficult to simply sit in a circle and talk about our feelings. It was through the doing that we could connect.
Death professionals have long been confounded by the difference in men and women in visiting gravesites, which is that the men tend to visit more often. My own experiences have given me a deeper understanding of why this takes place. Men tend toward linking their grief with a place, action, or thing. There have been many examples presented in this book: the man who wore his deceased daughter's ring as a remembrance of her, the man who carved a bust of his wife after her death, the man who built a pond in memory of his murdered brother, the man who wore his father's watch, and so on. These activities are often quiet and unseen by most people. The casual observer might assume that the man is "not grieving," but that is many times not the case.
I have found a wide variety of activities that, like planting the tree, help me in connecting to my inner spheres. Writing, gardening, and music are examples. All of these activities can take me into myself and my grief and joy.
Another activity I have used is a ritual practiced by Cree Indians, as discussed in chapter seven. Tree wounding is a simple and beautiful ritual. Following ancient custom, Cree men who are grieving go into the forest, select a tree, and after uttering a prayer, strip away a piece of the bark. Now the tree, like the man, has lost something whose loss causes deep pain. Many times over the following months the man will return to visit the tree. As the seasons pass, the wound in the tree heals, and so does the wound in the man's heart. With the tree as a visible reflection of his loss, the man is reminded that he, too, is healing.
In this ritual there is both an action and a place, and both serve as "containers" or "hooks" for the inner state of the man. As the man performs the action or visits the place, he is afforded the opportunity to experience his pain and to have his healing reflected back to him. I have used this ritual a number of times and have found it extremely helpful. The trees I have chosen are mostly in my back yard, and they stand as reminders to me of my grief, pain, and healing.
The use of activity as a means to connect with one's grief is not exclusive to men; women also find this approach helpful. The difference is that women have a strength in connecting their emotions to their words and then are inclined to "share" those words with the people in their life whom they love. This proclivity fits nicely with the keyword of "intimacy" that Deborah Tannen used to describe women in her book You Just Don't Understand. According to Tannen, a woman's world revolves around her intimacy and connection with others. We would expect that when a woman experiences the chaos of grief, a primary mode of healing will be connecting her pain with her intimacy to others.
Tannen uses the keyword of "independence" for men. When independence is your keyword, you are probably less likely to want to "share" your feelings with those around you. You will be more likely to seek out modes of healing that will be harmonious with your interest in maintaining independence. I know for myself, and for many men, the verbal connection is facilitated by linking it with some action, place, or thing. I am less inclined to simply "share" my feelings with those around me. I am grieving, but I do it in my own way, a way that is more quiet and less visible and harmonizes with my interest in independence. It is for this reason that it is unwise to judge a man's grief by how much he "shares" it with others. A man's pain cannot be judged by outer appearances or the abundance of tears. All people are unique in the ways they find to heal themselves. There are probably more individual differences in grief than there are gender differences, but the gender differences do exist and need to be honored.
My father's memorial tree now stands in a park that is adjacent to my home. Not only was the activity surrounding the tree helpful, now the tree has moved from being an activity to being a place. Each time I come or go I see that tree sitting there, being itself. When I see the tree I am reminded of my father, my grief, and the men who lovingly honored both my father and my pain.
Source: Thomas Golden, author of Swallowed by a Snake: The Gift of the Masculine Side of Healing, 2nd edition. golden@webhealing.com or www.webhealing.com. Thanks to Mensactivism.org for this submission.
Today's a good day to die. - Native American Proverb (Also commonly spoken in prison.)
The following number of people died this month: Chinese - 517,293; Americans - 195,743; Russians - 164,968; Brits - 50,793; Italians - 47,558; Spanish - 30,877 and Irish - 2,660. FHM, 6/02
Bela Lagosi has buried wearing his vampire outfit.
Lip Service: Reuters News Service gave its founder a 17-word obituary.
Health is merely the slowest possible rate at which one can die.
![]()
|
|